Performance metrics
Biodiversity
We collect data and information related to species occurrence and sensitive habitats located within or adjacent to our operated assets. We focus on species characterized as at-risk, endangered, rare, significant, threatened or of cultural value, and habitats characterized as sensitive by local regulators or conservation organizations as well as International Union for the Conservation of Nature (IUCN) I-VI protected areas. Data and information are used to develop metrics related to protected areas, restored or protected habitats and the IUCN Red List of Threatened Species.

Water
We measure and report the volume of fresh water1 and non-fresh2 water withdrawn from local water sources, the volume of municipal waste water reused, and the volume of produced water3 that is reused, recycled, disposed or discharged after treatment. The data are used to estimate our fresh water consumption intensity and exposure to water stress4. We also collect water forecast data for our annual Long-Range Plan process which enables us to test our portfolio of projects against our water risks to make better-informed strategic decisions.

Exposure to water stress
We use the World Resources Institute Aqueduct Risk Atlas to complete a screening level assessment of our portfolio exposure to water stress. For select assets we also verify the level of water stress using local water supply and demand data for a more detailed understanding. Operated assets located within areas of high baseline water stress in 2023 included parts of the Permian Basin and parts of the Eagle Ford. Overall, 14.7% of our fresh water withdrawal and 18.3% of our freshwater consumption was in regions of high water stress.


1 Regulatory definitions of fresh water can range from less than 1,000 to less than 4,000 milligrams per liter total dissolved solids (TDS).
2 Non-fresh water includes brackish/saline groundwater with ranges between 2,000 to more than 10,000 milligrams per liter TDS and seawater with about 35,000 milligrams per liter TDS.
3 Produced water ranges from less than 10,000 to more than 300,000 milligrams per liter TDS.
4 Estimated using the World Resources Institute Aqueduct Risk Atlas.
Metrics
Biodiversity
We collect data and information related to species occurrence and sensitive habitats located within or adjacent to our operated assets.1 We focus on species characterized as at-risk, endangered, rare, significant, threatened or of cultural value, and habitats characterized as sensitive by local regulators or conservation organizations as well as the International Union for the Conservation of Nature (IUCN) I-VI protected areas. Data and information are used to develop metrics related to protected areas, conservation and the IUCN Red List of Threatened Species.
PROTECTED AREAS | |||||||||||
0.03% | OF LEASE AREAS OVERLAP WITH PROTECTED AREAS1 | ||||||||||
12 | |||||||||||
PROTECTED AREAS WITHIN 3 MILES (5 KM) OF FIVE ASSETS | We complete an annual assessment of protected areas located within or adjacent to (3 miles or 5 km) operated asset lease areas. The assessment utilizes the latest version of the World Database on Protected Areas. Our infrastructure within or adjacent to protected areas includes pipelines, well pads, compressor stations, one LNG facility and one terminal. | ||||||||||
APLNG | Bakken | Permian Basin Montney | Teesside | |||||||||||
1 Estimated as the percentage of lease areas overlapping with designated protected areas using the World Database on Protected Areas. | |||||||||||
CONTRIBUTIONS TO CONSERVATION | |||||||||||
OVER | We consider contributions to conservation as enhancing, benefiting, improving or restoring habitats and ecosystems including from regulatory required or strategic voluntary biodiversity offsets, compensatory wetland mitigation and voluntary habitat restoration of company-owned lands. | ||||||||||
65,900 | |||||||||||
CUMULATIVE ACRES | |||||||||||
on company-owned lands and by operated assets. | |||||||||||
VOLUNTARY CONSERVATION AGREEMENTS | |||||||||||
OVER | Voluntary conservation agreements are formal agreements with the U.S. Fish & Wildlife Service and/or other federal or state agencies that include stipulations governing the timing of certain development activities within specific species habitats or sensitive areas. | ||||||||||
470,000 | |||||||||||
CUMULATIVE ACRES | |||||||||||
within Lower 48 operated asset lease areas. | |||||||||||
IUCN RED LIST SPECIES | |||||||||||
9 | ASSETS IN FOUR COUNTRIES | We identify local species of interest including species at-risk, endangered, rare, significant, threatened or of cultural value. Some of the local species of concern may also have been identified as near-threatened, vulnerable, endangered or critically endangered on the IUCN Red List of Threatened Species. | |||||||||
with at least one IUCN Red List species known to occur.2 | |||||||||||
2 The majority of our assets actively mitigate risks related to at least one species of local importance that is also an IUCN Red List species. | |||||||||||
Water
We measure and report the volume of fresh water2 and non-fresh3 water withdrawn, the volume of municipal waste water reused, and the volume of produced water4 that is reused, recycled, disposed or discharged after treatment. The data1 are used to estimate our fresh water consumption5 intensity and exposure to water stress.6 We also collect water forecast data for our annual Long-Range Plan process which enables us to test our portfolio of projects against our water risks to make better-informed strategic decisions.
FRESH WATER CONSUMPTION INTENSITY | ||||||||||
| ||||||||||
0.07 | BBL/BOE EUR1 | 0.03 | BBL/BOE2 | |||||||
UNCONVENTIONAL Bakken | Eagle Ford Montney | Permian Basin | CONVENTIONAL/OFFSHORE Alaska | APLNG | Ekofisk Surmont | Teesside | |||||||||
1 Calculated using Enverus data for the average volume of fresh water (BBL) divided by the average estimated ultimate recovery (EUR, BOE) as of April 1, 2025. Intensity value may change as EUR data is updated. EUR — estimated ultimate recovery. 2 Calculated using the average volume of fresh water (BBL) divided by the average annual production (BOE). | ||||||||||

Exposure to water stress
We use the World Resources Institute Aqueduct Risk Atlas to complete a screening level assessment of our portfolio exposure to water stress. For select assets we also verify the level of water stress using local water supply and demand data for a more detailed understanding.
Operated assets located within areas of high baseline water stress in 2024 included parts of the Permian Basin and parts of the Eagle Ford. Overall, 8.2% of our fresh water withdrawal and 10.4% of our freshwater consumption was in regions of high water stress.
1 2024 data reported for heritage ConocoPhillips operated assets.
2 Regulatory definitions of fresh water can range from less than 1,000 to less than 4,000 milligrams per liter total dissolved solids (TDS).
3 Non-fresh water includes brackish/saline groundwater with ranges between 2,000 to more than 10,000 milligrams per liter TDS and seawater with about 35,000 milligrams per liter TDS.
4 Produced water ranges from less than 10,000 to more than 300,000 milligrams per liter TDS.
5 Calculated as total fresh water withdrawn minus total fresh water discharged.
6 Estimated using the World Resources Institute Aqueduct Risk Atlas.
1 2024 data reported for heritage ConocoPhillips operated assets.

Regional water metrics1 | |||||||||
METRIC | Alaska (MM m3) | APLNG (MM m3) | Bakken (MM m3) | Eagle Ford (MM m3) | Permian (MM m3) | Montney (MM m3) | Norway (MM m3) | Surmont (MM m3) | Teesside (MM m3) |
Fresh water withdrawn | 0.66 | 0.27 | 1.5 | 3.0 | 0.07 | 0.78 | 0.16 | 1.3 | 1.3 |
Fresh water discharged | 0.17 | 0.29 | 0 | 0 | 0 | 0.01 | 0.16 | 0.05 | 1.4 |
Non-fresh water withdrawn | 9.0 | 0 | 1.0 | 7.6 | 5.8 | 0 | 23.8 | 0.11 | 0.13 |
Municipal wastewater reclaimed | 0.19 | 0 | 0 | 0 | 2.3 | 0 | 0 | 0 | 0 |
Produced water reused/recycled | 36.3 | 0 | 0.007 | 0 | 17.1 | 0.81 | 0 | 22.6 | 0 |
Produced water disposed | 0.0003 | 0 | 4.6 | 4.9 | 64.3 | 0.13 | 0 | 2.5 | 0 |
Produced water discharged | 0 | 0 | 0 | 0 | 0 | 0 | 16.7 | 0 | 0 |


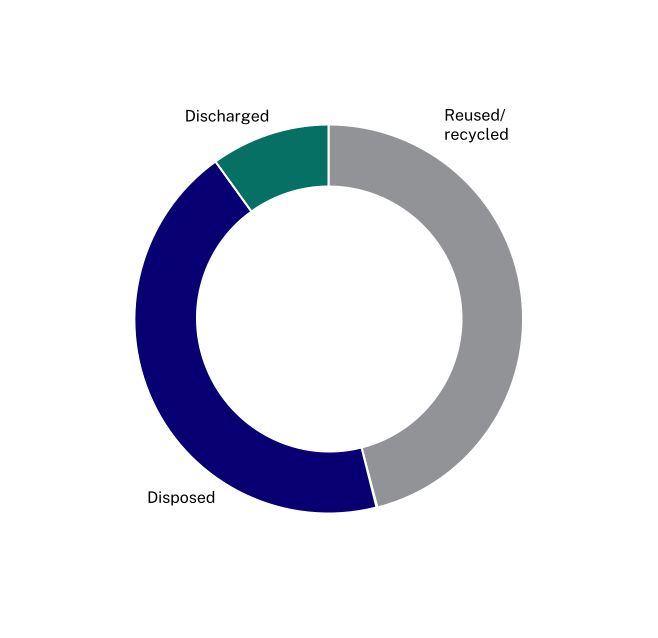

46%
OF PRODUCED WATER IS REUSED OR RECYCLED
44%
IS DISPOSED OF
10%
IS DISCHARGED OFFSHORE AFTER TREATMENT

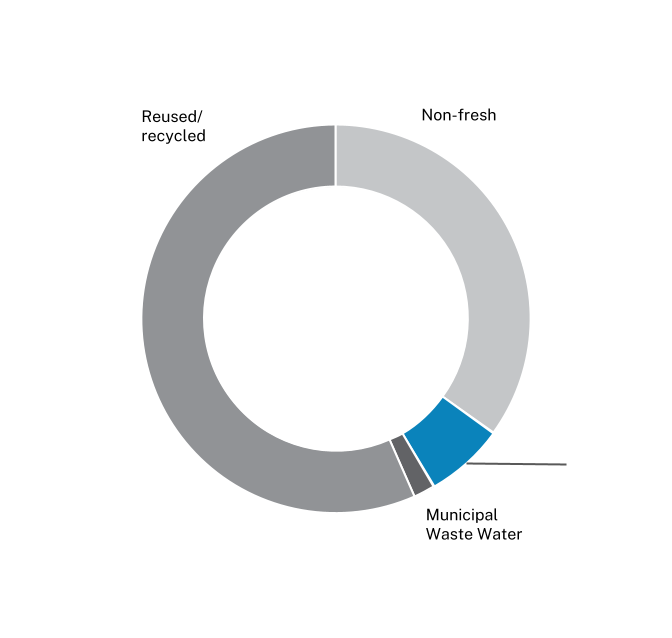
93.4%
OF SOURCE WATER IS
NON-FRESH WATER,
MUNICIPAL WASTE WATER AND REUSED OR RECYCLED PRODUCED WATER
6.6%
IS FRESH WATER
1 2024 data reported for heritage ConocoPhillips operated assets.

Source water — Global1 | Produced water managed — Global |